Harmonizing lipidomics

Chatting at a conference a few years ago, lipidomics researchers Markus Wenk and Andrej Shevchenko noticed a problem.
“We were having coffee over a break during the sessions, and we were thinking, ‘There are a lot of papers flying around now on plasma lipidomics,’” Wenk, of the National University of Singapore, said.
 Markus Wenk Many of those studies were looking for biomarkers, molecules that change reliably during the course of a disease and might someday be used for diagnosis. To detect potential lipid biomarkers, researchers compare the level of many lipid species in blood plasma from patients to those of healthy volunteers — often without determining an absolute molar quantity of either.
“The situation is very odd,” said Shevchenko, of the Max Planck Institute of Molecular Cell Biology and Genetics. “We cannot compare data … You identify significantly changing lipids, and do maybe thousands of analyses, but I cannot compare my results with yours.”
 Andrej ShevchenkoNot all biological studies must be strictly quantitative. Western blots, fluorescence imaging and many proteomics approaches rely on semiquantitative measurement. Likewise, a lipidomics study might show that people with a given disease have twice as much of a certain lipid as healthy individuals. If later studies back up the finding, the molecule in question begins to look like a promising analyte to screen for the disease.
For a lipid to be useful in the clinic, however, researchers must agree on the identity of the molecule in question and on how much of it to expect in a healthy person. Lipidomics researchers are working toward such agreements; their field-wide project is mostly collegial but sometimes contentious and provides a case study of how scientists create systems of measurement.
Lipidomic beginnings
The most common lipid biomarker is cholesterol. Clinical laboratories use an assay with colorimetric readout to measure cholesterol in a patient’s blood plasma. A lab’s confidence in its measurement comes from running control samples with each assay and from external certification.
 Lipid researchers have found numerous molecules that might someday predict diseases such as Alzheimer’s, cancer and metabolic disorders as effectively as cholesterol predicts the risk of heart attack and stroke. But cholesterol is by far the most abundant lipid in the blood. To measure molecules with much lower concentrations, scientists must use methods with higher sensitivity, such as mass spectrometry, or MS.
 Forty years ago, using a mass spectrometer to measure lipids seemed impossible. The technique starts by ionizing molecules to measure their mass-to-charge ratio; lipids, many of which are nonpolar, can be difficult to ionize.
When he started measuring lipids in the 1980s, Richard Gross, a mass spectrometrist at Washington University in St. Louis, would homogenize buckets of samples to harvest enough of certain subcellular membranes to detect. Though the fundamentals of mass spectrometry are the same, instrumentation has advanced a great deal since then.
 Richard Gross“Nothing has changed in the last 40 years,” Gross joked, “except the ion sources have improved by five orders of magnitude, the ion traps have improved, and so has detector resolution. We’ve gone from working with garbage cans and canoe paddles to working in Eppendorfs.”
Gross’ lab was among the first to measure lipids extracted from tissue by MS, publishing its first paper on the work in 1984. “From my perspective, that was the beginning of lipidomics,” he said, “although lipidomics wasn’t going to be a word for 20 years.”
What took the technique so long to catch on? Kai Simons, former director of the Max Planck Institute of Molecular Cell Biology and Genetics, blames the molecular revolution in biology.
 Kai Simons “It was DNA, RNA, proteins,” Simons said. “There was so much to do. Many of the most creative young researchers wanted to do what they saw before them — and lipids were not included.”
Nonetheless, analytical chemists continued to make technical progress. In 2003, the word “lipidomics” made its debut in the peer-reviewed literature. Threereviewarticles in quick succession pointed to a trickle of papers demonstrating robust mass spectrometric measurement of lipids and argued that, like the growing field of proteomics, high-throughput lipid measurement was poised to take off.
The legacy of LIPID MAPS
Before lipidomics even entered the lexicon, Edward Dennis of the University of California, San Diego, says he made a case to the National Institutes of Health that the field would be a great investment. The NIH budget had doubled in the previous five years. In 2000, the National Institute for General Medical Sciences introduced a new funding mechanism called the glue grant intended to propel interdisciplinary science forward with up to 10 years of funding for projects with multiple principal investigators. Dennis thought he had just the project. Edward Dennis
“Developing an integrated metabolomics system capable of characterizing the global changes in lipid metabolites is a daunting task, but one that is important to undertake,” Dennis wrote in his initial application.
The Lipid Metabolites and Pathways Strategy, or LIPID MAPS for short, got the grant. Its 12 PIs set out to develop rigorous laboratory and bioinformatics techniques for lipidomics with approximately $73 million from the NIGMS over 10 years.
By current estimates, human blood contains millimoles of hydrophobic cholesterol but only tenths of a nanomole of the hydrophilic signaling lipids called eicosanoids: a 10 millionfold difference in molar abundance. With such chemical diversity and varied abundance, lipid measurement requires multiple approaches.
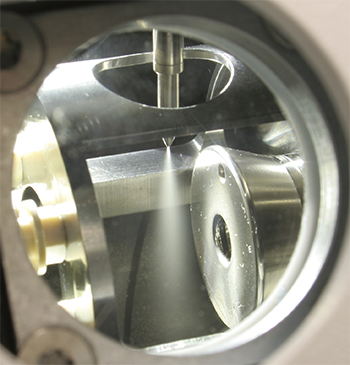 Many lipidomics studies use electrospray ionization. This photo shows the ionization source in a mass spectrometer. The sample is ionized while it’s sprayed from the needle, and gaseous ions then enter the mass detector to the right.WIKIPEDIA/THETWEAKER The LIPID MAPS consortium chose core labs specializing in different lipid classes to lead methods development for each class. Al Merrill of Georgia Tech led the sphingolipid core.
“From the very beginning, the hope was that the field was going to explode,” Merrill said. “Our goal was to do anything we could to accelerate that process, and seeing it happen would be the biggest reward for our efforts.”
The consortium developed a widely used system for classifying lipid types, referring to them by standard names and drawing them consistently. The American labs worked with leading Japanese and European lipid biochemists to reach consensus on the system before publishing it. According to Dennis, this collaboration helped to clarify later conversations.
“Everyone in the world has accepted our nomenclature, our classification and our structure drawing program,” Dennis said. “There is no conference that argues about nomenclature … it’s just accepted by the worldwide community.”
 Al Merrill LIPID MAPS labs used identical instruments to determine structures and quantities of thousands of lipid species and built a website where researchers could search for features in mass spectra and match them to known structures.
After the project’s funding expired in 2013, its large-scale collaborative projects came to a halt, but most of its researchers kept working in lipidomics.
Shevchenko, who was trained in proteomics and has worked with lipids for about 20 years, believes LIPID MAPS settled on instruments and approaches a little too early in the process of global methods development.
“With all my respect to colleagues, in 2006 the field was in its infancy,” he said. “Just being able to see lipids and quantify (them) … was a big step forward. People would look at this with big respect. But that doesn’t mean the right thing to do was to standardize the approaches. Because there were no approaches to standardize. Right? There’s no way around this — just to wait and let the field develop.”
When do you standardize? I think he makes a good point,” Dennis said in reply. “(But) I don’t think LIPID MAPS attempted to set the standard protocol or ever said it did. LIPID MAPS developed the best damn protocol it could, used that approach to measure plasma, and published it.”
Quantifying a lipidome
A LIPID MAPS capstone project was to quantitate as many lipid species as possible in human plasma, using the technologies the consortium had developed. They chose a plasma sample supplied by the National Institute of Standards and Technology, or NIST, pooled from 100 volunteers, middle-aged men and women whose ethnicity matched the average U.S. population.
 Standard Reference Material 1950, a pooled sample of plasma from 100 volunteers, has been the subject of numerous lipidomics studies.NATIONAL INSTITUTE FOR STANDARDS AND TECHNOLOGY NIST develops many such reference materials for calibration of clinical assays. This particular sample, called Standard Reference Material 1950, came with certified measurements of cholesterol, triglycerides, free fatty acids, and several steroid hormones and lipid vitamins. Otherwise, the lipid content was largely unknown.
Each LIPID MAPS core laboratory used the quantitative techniques that it had optimized for its class of interest to extract lipids from a vial of SRM 1950, measure them and report back. The consortium measured just shy of 600 lipid species in six classes and published its findings in the Journal of Lipid Research.
In 2011, the year after the LIPID MAPS study was published, analytical chemist John Bowden took a job at NIST. With the field of lipidomics expanding, he saw the post as an opportunity to contribute to standardization.
“I tried to spread the message at NIST that we needed to help standardize and harmonize the community in this type of measurement,” said Bowden, now a professor at the University of Florida. “At the time, it was not a community-wide priority.”
 John Bowden Bowden and his team launched a comparison exercise in 2014, using SRM 1950 to determine the variability in lipid identification and quantitation among 30 labs. Bowden told ASBMB Today in 2017, “We (asked): ‘How much variability exists in the community right now, with all the different methodologies and philosophies for measuring lipids?’”
Each lab measured lipids in triplicate according to its usual protocols, reporting concentration estimates for anywhere from 100 to 1,500 species. Candice Ulmer, a postdoc on Bowden’s team, said the guidelines were intentionally vague. “We gave them free rein (in order) to see, if there’s no guidance provided, how do they go about assigning concentrations?”
After anonymizing individual labs’ measurements, Bowden’s team calculated a consensus mean, a median of the average concentration measured at multiple labs, for each lipid species. The median of means was more robust than a weighted average to outlier values, of which there were several. Ulmer said, “Our idea with the consensus mean values was to provide concentrations that are robust and independent of the instrumentation … and the type of data processing tools you use.”
 Candice Ulmer The disagreement among labs was considerable. “The problem was that (NIST) wanted to be neutral,” said Kai Simons, the former Max Planck Institute director who now runs Lipotype, a company that participated in the study. “They didn’t want to provoke a critical discussion, which would have been quite devastating.”
Reception of the study, published in the Journal of Lipid Research, was as mixed as the laboratories’ estimations of lipid concentration.
Oliver Fiehn, a metabolomics expert at the University of California, Davis, who participated, said that when measurements are technically challenging and protocols differ, expecting perfect concordance is unrealistic. “People always think that we should all get the same results … (but) every single ring trial shows that there’s always a distribution of values.”
 Xianlin Han Fiehn called the study a success. “Is the glass half full or half empty? If (others) say it’s half empty, I’d say its half full.” Xianlin Han, who wrote one of the 2003 lipidomics review articles, called the study a failure. “It turned out the result could be a threefold difference,” said Han, of the University of Texas Health Sciences Center at San Antonio. “So what do the data mean? Later on, if I want to study lipidomics in plasma, I can report any data, refer to this paper, and say, ‘Hey, my data are within this range.’ That’s a disaster. The outcome would be very different if the organizers had spiked a few standards into the NIST plasma sample as controls.”
For Bowden, establishing the lack of agreement on how to conduct and quantify lipidomics experiments was precisely the point. “At the time, we really did not know what the exact issues were in lipid measurement across the community,” he said.
The study helped participating laboratories spot problems in their workflows and got the community talking about measurement quality, Bowden said. “There was a thinking that everybody was doing the best we could, given the resources … but if we put enough energy into certain areas, then maybe we can actually make better lipidomics measurements.”
Identifying features
What would it take to improve lipidomics measurement?
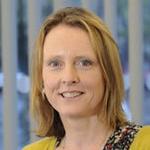 Valerie O'DonnellValerie O’Donnell, a professor at Cardiff University, specializes in analysis of phospholipids and their signaling byproducts. “Up until 12 or 15 years ago, lipid research was a relatively small field,” O’Donnell said. “Everyone knew each other; it’s always been an extremely collaborative but relatively small field of specialists who worked on individual lipid classes.”
Everything changed around 2005, O’Donnell said, when new benchtop mass spectrometers made the technology accessible to more labs. “From then on, you didn’t have to be a physicist and understand how to take apart and put back together a mass spectrometer to use it to measure lipids.”
Instrument resolution also improved, making it possible to distinguish lipid species more accurately. According to Bowden, “We’re uncovering all kinds of new lipids, and we’re able to separate out lipids you couldn’t separate out before.”
These factors have drawn more researchers to look into the lipidome. But that growth brings challenges. “With lots of new people coming into the field,” O’Donnell said, “there are emerging issues around how you identify lipids.”
 The major challenge is that any one feature in an MS spectrum could represent a large number of molecular species. To be sure of a lipid’s structure, a researcher needs several dimensions of information, far more than a single MS run provides.
Bowden and his NIST colleagues wrote a primer on reporting one’s degree of certainty in identifying a peak in a special issue of the journal Biochimica et Biophysica Acta in 2017. In the same issue, another paper explicitly called for standardization of lipidomics data. Its authors include two scientists Bowden met during the NIST study: Kim Ekroos, an independent lipidomics consultant in Finland, and Gerhard Liebisch of the University of Regensburg in Germany.
 Kim Ekroos Liebisch and Ekroos had come across a troubling case of peak misidentification in a 2015 paper in the journal Clinical Chemistry. Using standard metabolomics, the authors reported finding six lipids that were higher in healthy volunteers’ serum than in samples from people with Type 2 diabetes.
“We question the identities of the reported biomarkers and the lack of validation thereof,” Liebisch, Ekroos and colleagues wrote in a reply to the editors. They pointed out that the authors had reported more information about acyl chain length and position for some lipid species than their data could reasonably provide. Moreover, some species were at unreasonable masses, suggesting they might be wrongly identified.
 Gerhard LiebischThe authors of the original study protested that they’d given adequate information under guidelines from the Metabolomics Society’s standardization initiative. There was, they conceded, an error in one of their annotations: a lipid species with one double bond was described incorrectly as having none, accounting for the wrong mass.
Liebisch said the exchange demonstrated that “lipids should be considered a special case of metabolites, where simple matching of (spectral) features is not sufficient.”
 Michael Wakelam It also motivated the pair to think about problems in the field. Ekroos said, “We are starting to see quite a few errors in published data already … that we want to somehow try to clear up.”
Michael Wakelam, director of the Babraham Institute associated with Cambridge University, has been doing lipidomics studies for more than 25 years and agrees with Ekroos. “We are seeing more and more of this,” Wakelam said of error-prone papers. “I think it’s actually a byproduct of the success of the field.”
 The LIPID MAPS website, redesigned in 2018, curates MS data on lipids and collects information about methods and tools.
LIPID MAPS returns
By 2016, it was clear to many experts that lipidomics researchers needed help with standardization and reproducibility. Today, three overlapping groups are working on the problem. One has begun work to revitalize LIPID MAPS as a resource for researchers in the field, a second has focused on technical problems in plasma lipidomics, and a third wants to reform publishing and reporting standards for all lipidomics data.
The first team, led by O’Donnell and Wakelam in the U.K., has spearheaded the continuation of LIPID MAPS. When NIH funding ended in 2013, lead bioinformatician Shankar Subramaniam, a University of California, San Diego, professor, landed a small bridge grant to keep the website online.
“They were at the point where they were thinking that it may have to get shut down,” O’Donnell said. “I felt that was really bad, because we use this (tool) all the time, and we couldn’t do our work without it.”
Wakelam, Dennis, Subramaniam and O’Donnell applied to the U.K.-based Wellcome Trust to revitalize the database. The project migrated to the U.K., and curation of lipid species and MS data resumed on a redesigned website.
“LIPID MAPS wants to play a big role in signposting our lipid biochemistry colleagues to what’s out there for big data analysis,” O’Donnell said. “Previously, it was a research project … but at the moment it’s really (about) the database and having it available as a global online free open access resource.”
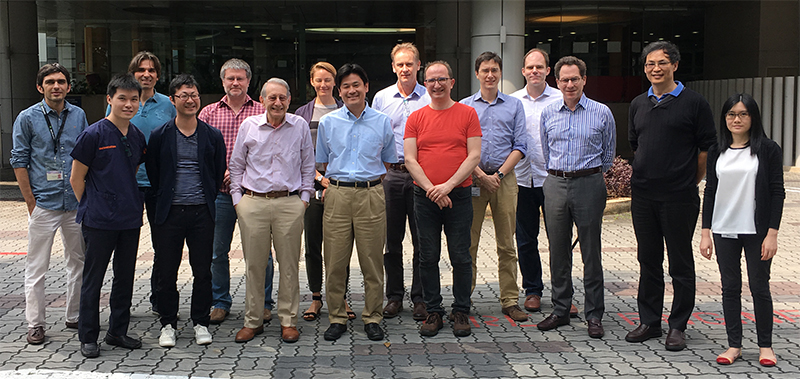 This group photo was taken at a 2017 forum on harmonizing plasma lipidomics held in Singapore. After they noticed confusion in the field, Markus Wenk (third from right) and Andrej Shevchenko (fifth from left) invited fellow lipidomics researchers to meet and hash out a path toward reference values for lipids in the blood.MATEJ ORESIC
The Singapore workshop
At the 2016 Lipidomics Forum, where Wenk and Shevchenko shared impressions over that cup of coffee, the two also gave the opening and closing keynotes; they discussed finding, respectively, quantitative variations within a healthy individual’s plasma lipidome and further variability among individuals according to age, ethnicity, sex and prescription medications.
Both thought groundwork was needed before biomarker discovery studies went forward. “Rather than study disease or complications, one needs to first actually get an idea of healthy baselines,” Wenk said.
That means finding out which lipids are stable in healthy adults and which ones vary by the hour — and determining how labs might reliably measure each of those. Wenk and Shevchenko knew that if the goal was consensus on these points, they needed other scientists to buy in.
“If you publish a small article and say, ‘Hey guys, we are in a position to teach you how to do lipidomics,’ the field will not respond,” Shevchenko said. “We have to be united.”
Wenk agreed. “I don’t think you can tell scientists what they have to do. You need consensus. We’ve been very careful about this.”
Shevchenko and Wenk reached out to established PIs working on plasma lipidomics. Dennis, Ekroos, Han, Liebisch, Wakelam and 13 others responded, and in April 2017, the two hosted a two-day meeting in Singapore. Members of the group specialized in various lipid chemistries using a variety of instruments and platforms. Their mission: figure out how to harmonize studies of the plasma lipidome.
“Of course, we all do it a little differently,” Dennis said. “Nobody said, ‘Oh, you do it right, Mr. X, we’ll all just use your protocol,’ because everybody’s invested in different approaches.”
The workshop hadn’t been going on long when Tze Ping Loh spoke up. Loh, a consulting physician in the laboratory medicine department at Singapore’s National University Hospital, was a rare bird among the panelists, a clinician in a room full of basic scientists.
“We’re all doing analytical chemistry,” Shevchenko said. “To get grants, we used to call (our work) biomarker or diagnostic discovery. But we don’t do diagnosis. And then Tze Ping, the guy who actually does diagnosis … explained to us what a diagnostic is actually and how far we are from (that). He really hit us in the head.”
 Loh explained the practice in laboratory medicine of establishing reference intervals, the range of concentrations of a molecule measured in a chosen population when all labs agree to measure in the same way.
To define a reference interval is to come to a consensus on what an analyte is, how to measure it accurately and reproducibly, in which populations it should be measured, and the statistical procedures to calculate it.
The cholesterol test is a good example. In its report, a clinical lab notes how the patient’s total cholesterol levels compare to recommended targets. That gives a robust health indicator that any doctor or nurse can interpret.
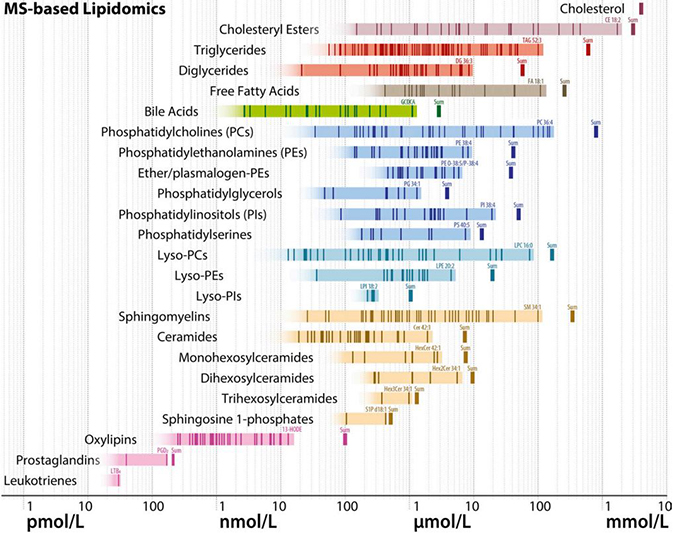 A schematic diagram shows estimated molar quantities of various lipid classes in human plasma, measured by mass spectrometry. Each vertical line represents an individual lipid species, and horizontal bands of color represent range estimates. Lipidomics researchers are trying to narrow down these estimates and make sure they match ranges known from clinical chemistry.BURLA ET AL. / JLR 2019
Loh’s interjection helped move the conversation from debate over the merits of different technical approaches to comparing measurements among these platforms, Shevchenko said. He attributes the productive conversation in part to Wenk.
“This is Markus’ talent. He’s a guy who has a vision to organize people without insulting them. So he got us together, with (our) different platforms, different approaches, different backgrounds,” Shevchenko said.
 Tze Ping Loh Galvanized by that first day, the workshop’s attendees started to lay out a plan for harmonization, beginning with broad-strokes guidelines for lipidomics research.
Balancing biases and adjudicating conflicts among research camps can derail attempts to standardize. The article in the Journal of Lipid Research that came out of the Singapore working group took no stance on most technical questions. Instead, the authors stressed the importance of using internal standards, determining molar concentrations of each analyte and working toward evidence-based agreements on other technicalities.
At a follow-up meeting in November, researchers were invited to help select the lipid species most amenable to clinical development. “When you come to all this granularity — they’re all scientists, right?” Wenk said. “By paring it to a single task, my hope is that it will be easier to come to a general best solution to that particular problem.”
The group settled on ceramides and bile acids because these two classes of molecule have well-defined roles in disease and are thought to be abundant, durable and easy to isolate. The research community can now work toward defining a method for measuring these specific lipids and determining their range in healthy individuals, Wenk said.
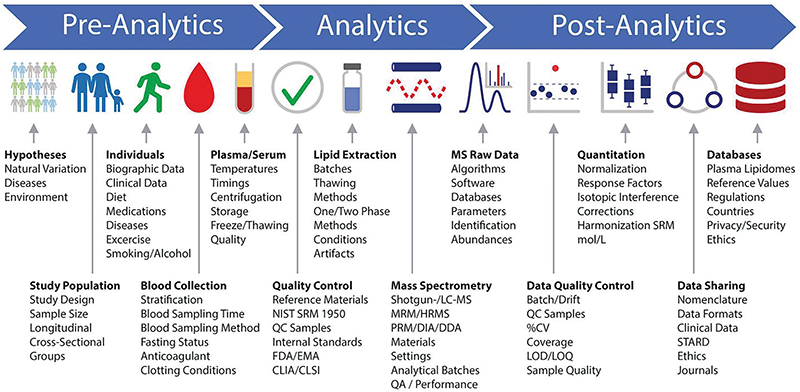 A lipidomics workflow schematic developed by participants at the Singapore lipidomics forum shows many points where a researcher’s decisions can introduce variability in a lipidomics experiment — even before a sample is loaded into the mass spectrometer. For example, many labs store and handle blood samples on ice to slow biochemica reactions and delay lipid oxidation. But that chilling may activate platelets, which then release bioactive lipids. Research groups interested in measuring those particular lipids reproducibly may handle samples at room temperature, perplexing colleagues from other labs.BURLA ET AL. / JLR 2019
The standards initiative
Ekroos and Liebisch, the researchers who took biomarker hunters to task in Clinical Chemistry, participated in the Singapore meeting but found it too narrow in scope. In early 2018, they launched the Lipidomics Standards Initiative, or LSI. The two said they want to focus on getting standards for reporting methods and identifying lipids accepted by researchers in the field and demanded by journals.
“That’s an initiative that is more overarching than ours, that aims at standardization in principle,” Wenk said. “It’s a much more heroic effort.”
Modeling their project on efforts in metabolomics and proteomics, Liebisch and Ekroos started a website with guidelines for the design and analysis of quantitative lipidomics experiments, which Liebisch described as a summary of current best practices. They also provided space for discussion about the protocols.
“We can’t really write these rules in stone today,” Ekroos said. “They have to be pretty open. But they should at least guide people to do more what is correct.”
Perceiving a common mission, the LSI quickly partnered with LIPID MAPS. The groups held a joint workshop at the European Lipidomics Meeting in October to introduce both projects.
“I haven’t seen so much debate and argument, constructive discussion, in a long time at a meeting,” O’Donnell said. “People got really animated about different methods and different approaches.”
Participants debated “everything from the start of the acquisition process right through to the data analysis … and reporting guidelines,” O’Donnell said.
A carousel of meetings
So what happens next in lipidomics?
Other fields of analytical chemistry, such as proteomics and metabolomics, have formed standing committees, and the LSI seems poised to follow that model. But Wenk believes forming a society for the harmonization of lipidomics, while helpful, could be an added burden for researchers.
“One needs to leverage what’s there,” he said. “One of those things is a roster, or a carousel as I call it, of small to medium-sized conferences.”
Wenk envisions a decentralized approach to standardizing the field, where researchers come together at conferences, hash out clearly defined issues as they did in Singapore and then send a report on to the next conference.
Conference organizers including Keystone, Gordon and the American Society for Mass Spectrometry have added lipidomics meetings to their programming for this year and 2020. These come in addition to existing periodic meetings in Europe, Australia and Japan. The LSI and LIPID MAPS plan to host workshops at the Keystone meeting.
“I think there’s a pocket of people that are spearheading this,” Bowden said. “But I think the ultimate goal is that everybody gets involved at some point, and it’s not just a couple of people.”
However the field organizes its next steps, Shevchenko said, he sees enthusiastic support from the community. “I love the words ‘critical mass,’” he said. “We’ve reached a critical mass of knowledge, of experience and of interest in transparent and confident lipidomics.”
Scientists who contributed expertise but were not quoted in this story include Shankar Subramaniam, Eoin Fahy, Erin Baker, Bo Burla and Tze Ping Loh.
What is a lipid?
 The LIPID MAPS consortium established a classification system for lipid molecules. This figure, from the consortium’s study of the lipidome of a pooled plasma sample, shows how the six major lipid classes (fatty acids, glycerolipids, glycerophospholipids, sphingolipids, sterols and prenols) are synthesized and interconverted as well as how they relate to other lipid metabolites.QUEHENBERGER ET AL. JLR 2010
Lipids are partly or completely hydrophobic small molecules. The simplest is a fatty acid, a carboxylic acid with a hydrocarbon tail. By adding fatty acids to other molecules via esterification, or by elaborating on a few other building-block molecules like acetyl coenzyme A, cells can make a tremendous variety of molecules that fit into the lipid class; LIPID MAPS’ database includes some 40,000 molecular species. In animal cells, these lipids fall into six classes.
Lipids famously form the plasma membranes that contain cells and eukaryotic organelles, and triglycerides are stored for energy in lipid droplets. Lipids also can function as coenzymes (for example, ubiquinone in the mitochondrial electron transport chain, or vitamin K) and as diffusible signaling molecules (a well-known example is S1P).

How does mass spectrometry work?
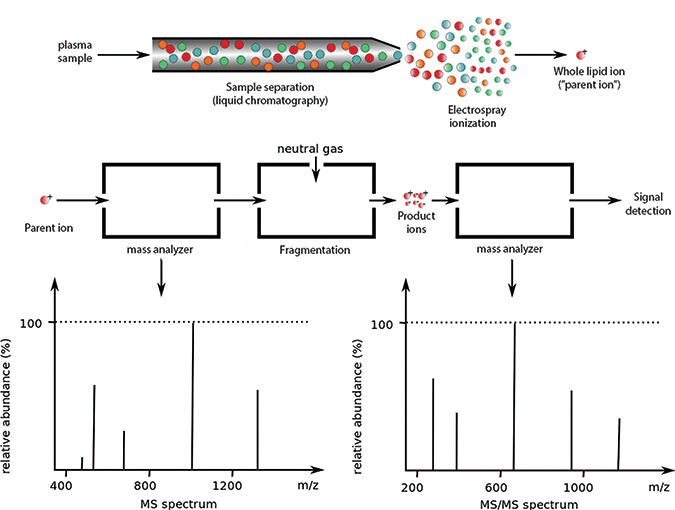 Lipidomics experiments often begin by separating a sample through liquid chromatography (top). After ionization, the sample is passed through one or more mass analyzers (middle). The spectrum from the first detector (bottom left) represents ionized whole molecules. In tandem mass spectrometry, some parent ions are broken down and further examined by a second mass analyzer, which produces the second spectrum (bottom right). For more on how product ions are formedADAPTED FROM WORK BY PHILIPE HUPE/WIKIMEDIA
Mass spectrometry is the process of ionizing a sample, separating the ions by mass and charge, detecting the ions, and recording a spectrum.
The output can be viewed as a series of mass-to-charge ratios (also called features or m/z peaks) whose height represents their abundance. By determining the elemental composition of a peak, researchers can determine which molecule it might represent — a process called annotation.
Many experimental approaches elaborate on the core ionization-separation-detection workflow. For example, using tandem mass spectrometry, a researcher can choose a peak from the first spectrum and break it down further into constituent ions. It’s also possible to separate a sample into fractions before ionizing it.
Whether to fractionate samples is a long-running debate in the field. In shotgun lipidomics, complex lipid extracts are injected straight into the mass spectrometer. By contrast, liquid chromatography separates lipids according to their size or chemical properties before ionizing them.
Analysis of a spectrum can be complicated by factors such as the existence of lipid isomers (compounds with the same composition but different structures) and ionization suppression, which happens when two analytes affect each other’s chances of picking up a charge. Because differences in technical approaches affect ionization and other variables, instrumentation and workflow may introduce biases into different labs’ estimates of lipid ratios.
To estimate the amount of a lipid in a sample accurately, a researcher must compare its abundance to a known concentration of a standard — usually a lipid synthesized either with a heavy isotope of carbon or hydrogen or with an unnatural odd-numbered acyl chain. The standard needs to have chemical properties as close as possible to the lipid of interest so it will behave roughly the same way in the mass spectrometer. According to Al Merrill of Georgia Tech, choosing standards can be difficult for researchers interested in a lot of lipids at once.
“There are so many lipids that they occupy a very large fraction of the possible masses that would be detected by mass spectrometry,” Merrill said. “Once you add these new materials, there’s a potential that they occupy the space of something else that you might need to analyze.”

Levels of lipid identification
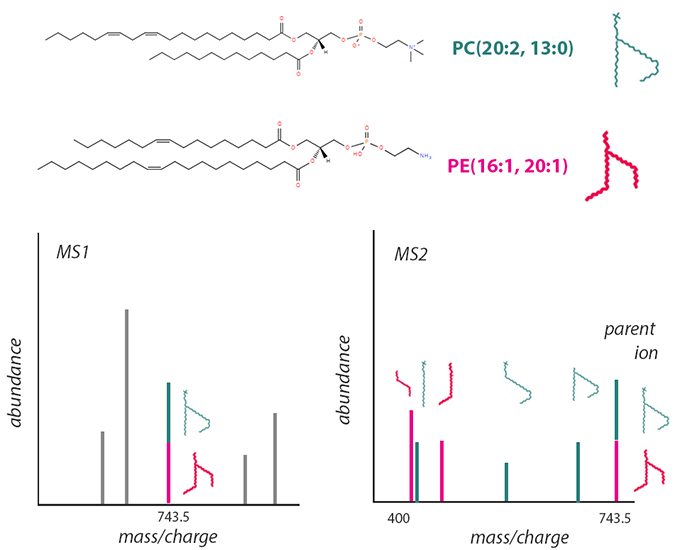 This schematic, based on information from LIPID MAPS, shows one way structural isomers can introduce challenges in mass spectrometry–based lipidomics. The phosphatidylcholine (top) and phosphatidylethanolamine (middle) molecules shown have the same chemical formula. After soft ionization, both have the same mass-to-charge ratio and appear as one peak in an MS1 spectrum (lower left), even though they may behave differently as part of a membrane. More destructive ionization enables researchers to differentiate the two by their fragmentation in MS2 (lower right).LAUREL OLDACH
According to analytical chemist John Bowden, who led a NIST lipidomics study, “Every level of identification of a lipid requires some specific piece of data to support it.”
When analyzing a mass spectrometry experiment, researchers interpret a feature, usually a spectrum peak, to annotate it or label its identity. There is a limit to how much structural information a researcher can determine from a parent ion: the lipid’s class or head group, the combined length of its fatty acyls, and how many carbon- double bonds or rings are in the structure. It’s impossible to tell how fatty acyl groups are oriented on the head group, and where in a fatty acyl chain double bonds occur, without breaking the molecule into smaller ions to be analyzed with tandem mass spectrometry.
Moreover, because distinct molecular species can have the same mass-to-charge ratio, researchers must reckon with overlapping peaks. For example, the two phospholipids pictured are structural isomers. Though they consist of different head groups with four distinct acyl chains and have distinct chemical properties, they have the same elemental makeup. To tell them apart, researchers would need to break down a parent ion into smaller parts.
LIPID MAPS and the Lipidomics Standards Initiative seek to promote annotation that specifies the degree of certainty about a lipid’s exact molecular structure according to how an experiment was carried out.

Talking about reference intervals
A conversation between Andrej Shevchenko and his mother, a physician, illuminates the gap between discovery lipidomics and what might be useful in the clinic. This is Shevchenko’s account of their exchange, lightly edited for clarity:
My mom is a medical doctor. She’s had an M.D. for like 45 years as a practicing physician in a humble neighborhood, no science. She knows that I’ve been doing this plasma analysis in a clinical context, and she once said to me, “You know what, Andrej? I think you do rubbish.”
I was like, “Why?”
She said, “When a clinical analysis comes to my desk — talk about cholesterol, for example, or blood pressure — I have a table. I know the norm and I know the variation … Do you have these sort of ranges for normal values in patients?”
I said, “No. We are kind of in the process.”
She said, “You guys are cheating people. You’re saying you are aiming at diagnostics, but how can you talk about diagnosis if you don’t have normal values?”
I was stumped. I said, “Yeah, but we are finding biomarkers …”
“Forget about this, it is all crap. Before you arrive at a reference value, what the normal parameter is, it’s all noise.”
And she is right. That’s what I think.

Enjoy reading ASBMB Today?
Become a member to receive the print edition four times a year and the digital edition monthly.
Learn moreGet the latest from ASBMB Today
Enter your email address, and we’ll send you a weekly email with recent articles, interviews and more.
Latest in Science
Science highlights or most popular articles
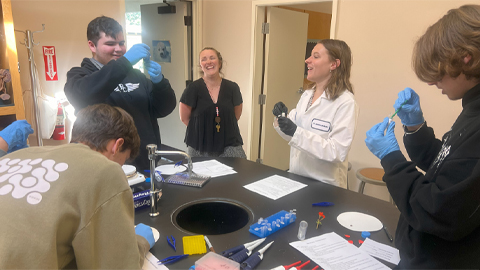
Using DNA barcodes to capture local biodiversity
Undergraduate at the University of California, Santa Barbara, leads citizen science initiative to engage the public in DNA barcoding to catalog local biodiversity, fostering community involvement in science.
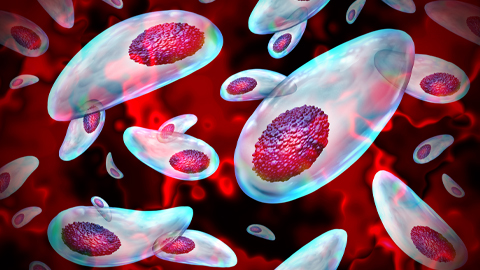
Targeting Toxoplasma parasites and their protein accomplices
Researchers identify that a Toxoplasma gondii enzyme drives parasite's survival. Read more about this recent study from the Journal of Lipid Research.
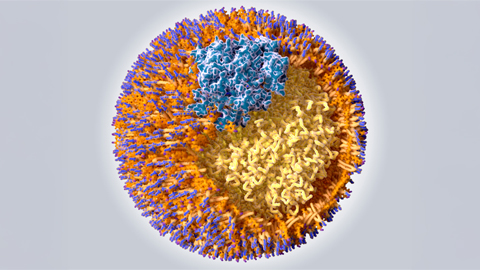
Scavenger protein receptor aids the transport of lipoproteins
Scientists elucidated how two major splice variants of scavenger receptors affect cellular localization in endothelial cells. Read more about this recent study from the Journal of Lipid Research.
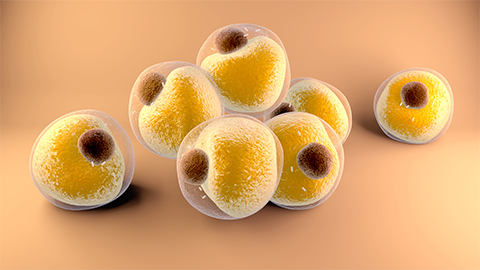
Fat cells are a culprit in osteoporosis
Scientists reveal that lipid transfer from bone marrow adipocytes to osteoblasts impairs bone formation by downregulating osteogenic proteins and inducing ferroptosis. Read more about this recent study from the Journal of Lipid Research.

Unraveling oncogenesis: What makes cancer tick?
Learn about the ASBMB 2025 symposium on oncogenic hubs: chromatin regulatory and transcriptional complexes in cancer.

Exploring lipid metabolism: A journey through time and innovation
Recent lipid metabolism research has unveiled critical insights into lipid–protein interactions, offering potential therapeutic targets for metabolic and neurodegenerative diseases. Check out the latest in lipid science at the ASBMB annual meeting.

